Title: Money Circulation Science (2006)
Client: New York Times Magazine, NY, NY
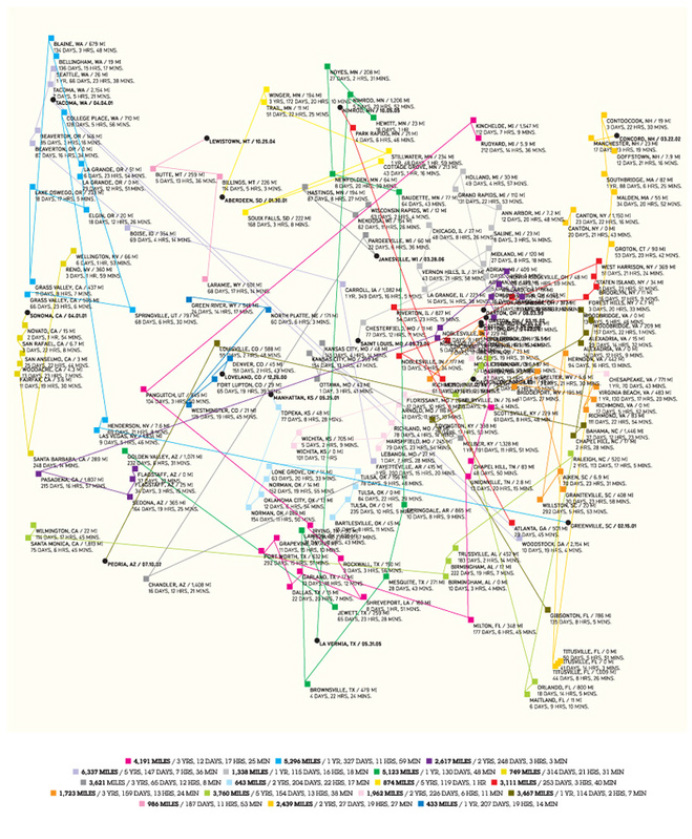
Project: This knowledge map was designed for the Year in Ideas issue, published each year in December. It depicts a visual snapshot of data over time from Whereisgeorge.com, a Website that tracks currency movement around the U.S. (notice how the design resembles a map of the continental U.S.) Site visitors can enter the denomination, series and serial number, as well as their ZIP code, which registers the date of entry. As more users contribute—and as others do so with the same bills at later dates—the better the record of where the bills travel. Over time, the site unwittingly amassed valuable data about the millions of journeys that people make from point to point. From the data, scientists were able to create a model to predict the probability of a bill staying within a 10-kilometer radius over a period of time—as compared with drifting 100 or 1,000 kilometers over the same period. The model can be used to predict the spread of more than dollars: in order to understand, for example, the spread of avian flu, you need to understand the patterns of mobility by which the disease will likely be spread.
(1 image follows)
Client: New York Times Magazine, NY, NY
Project: This knowledge map was designed for the Year in Ideas issue, published each year in December. It depicts a visual snapshot of data over time from Whereisgeorge.com, a Website that tracks currency movement around the U.S. (notice how the design resembles a map of the continental U.S.) Site visitors can enter the denomination, series and serial number, as well as their ZIP code, which registers the date of entry. As more users contribute—and as others do so with the same bills at later dates—the better the record of where the bills travel. Over time, the site unwittingly amassed valuable data about the millions of journeys that people make from point to point. From the data, scientists were able to create a model to predict the probability of a bill staying within a 10-kilometer radius over a period of time—as compared with drifting 100 or 1,000 kilometers over the same period. The model can be used to predict the spread of more than dollars: in order to understand, for example, the spread of avian flu, you need to understand the patterns of mobility by which the disease will likely be spread.
(1 image follows)